21 January 2021. Recently, a number of agencies have used food system visualizations (FSVs) to illustrate the complexity of these systems. IISD has reviewed a number of FSVs to compare how they focus on and represent different components of food systems and to assess how they cover policy and decision-making priorities, including the Sustainable Development Goals (SDGs). Find out
more.
There is increasing recognition that our food comes from a complex set of systems, encompassing agricultural techniques and ecosystems, as well as food security and nutrition—all of which are affected by different governance and policy choices. Recently, a number of agencies have used food system visualizations (FSVs) to illustrate the complexity of these systems. IISD has reviewed a number of FSVs to compare how they focus on and represent different components of food systems and to assess how they cover policy and decision-making priorities, including the Sustainable Development Goals (SDGs).
These findings come from a review of 32 different FSVs published between 1998 and 2020, although most of them were published after 2015. All these FSVs can be viewed on the
reference list.
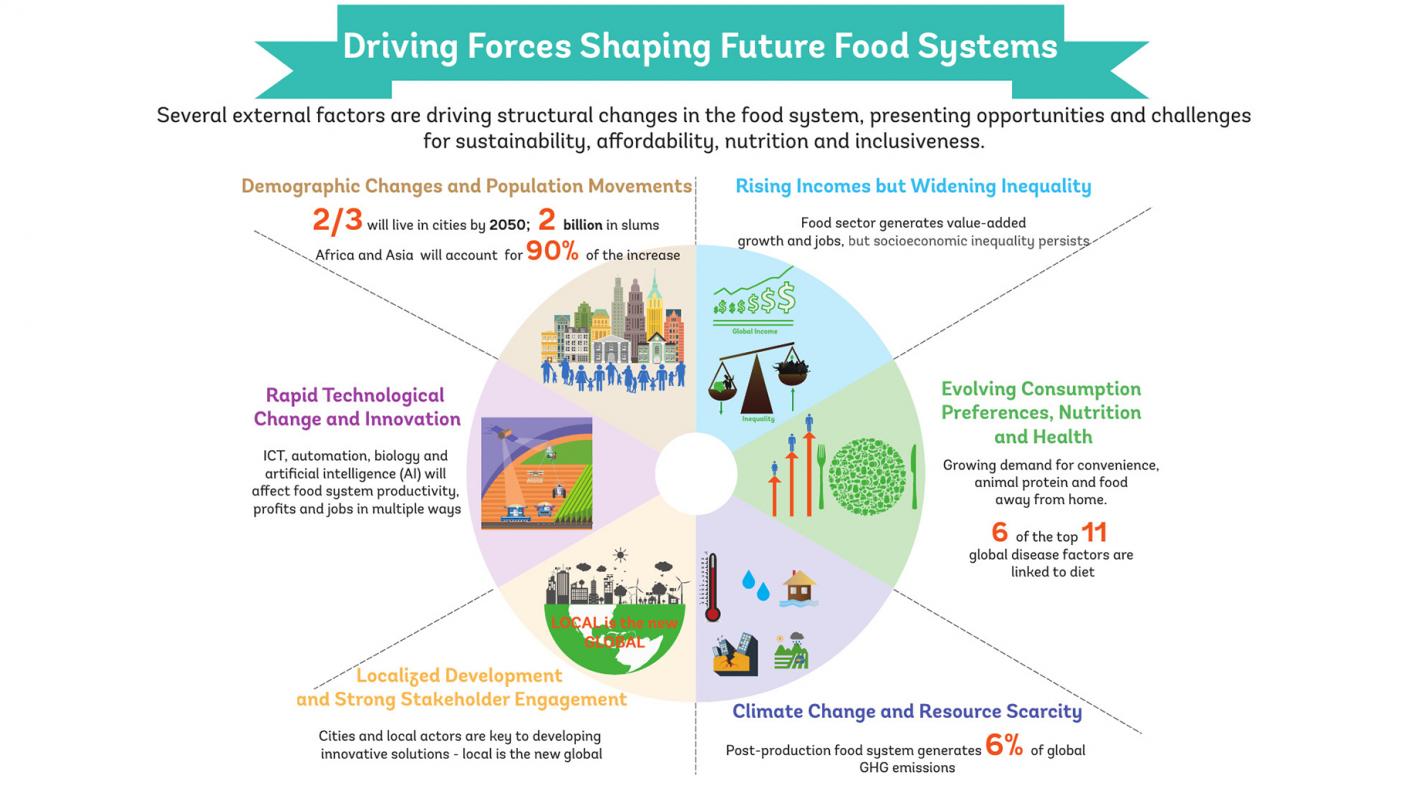
This kind of visual representation can help to illustrate not only the diverse components of food systems but also their linkages and interactions. Some of the FSVs specifically focused on particular aspects, such as climate change, deforestation, and greenhouse gas emissions, or community-based food systems and local economic development—in the latter case, to support local government planning and investment.

No comments:
Post a Comment